HP provided two weeks of remote access to an HP ZGX Fury at no cost through its Lighthouse evaluation program and reviewed this paper for accuracy about HP products. The experiments, results and opinions are my own.
The model was 549 GiB. The GPU held 250. It ran anyway.
For two weeks in September I ran a pre-registered set of experiments on an HP ZGX Fury as part of HP’s Lighthouse evaluation. HP lists 748 GB of unified memory for the system: HBM3e on the GPU and LPDDR5X on the Grace CPU, joined by NVLink-C2C into one address space. Everything below follows from that.
This is written for builders: AI and ML engineers, research computing leads, technical founders. Every number has a result file in github.com/VoxellInc/fury-desk, most with the script that produced it, and I put what failed next to what worked. Where I could only measure two machines instead of one, I say so.
At a glance
- 549 GiB: A 1.03-trillion-parameter model served on one HP ZGX Fury: 14.5 tokens per second for a single stream with 169 GiB of its weights on the GPU, averaged over three server loads. Receipt
fury-desk/results/H3_RESULT_v2.csv - 0.43 ms: Added time per token when 5 GiB of a 35B model’s experts sit off the GPU on the ZGX Fury, against 10.5 ms over PCIe on my workstation. Two machines, not one with the memory design toggled. Receipt
fury-desk/results/H1_RESULT.csv - 33% → 86%: Held-out accuracy on the main decision task after a 2.09-hour LoRA of a 27B model on the ZGX Fury, at a cost of 2.4 points on GSM8K. One training seed. Receipt
fury-desk/results/finetune/ - 0.70 ms: To score and rank 2,966 correlated combinations from ten thousand simulated paths on the ZGX Fury, byte-identical at every step. My workstation runs the same build in 0.45 ms. Receipt
fury-desk/montecarlo-data/
What the machine is, as measured
Why this matters A spec sheet tells you what a system could do, and a measurement tells you what your engine can use. The gap between the two decides whether a model fits. I measured the machine before I trusted either.
| Measured on the ZGX Fury | |
|---|---|
| GPU | NVIDIA GB300, 256,703 MiB (250.7 GiB), 152 streaming multiprocessors |
| GPU memory the inference engine can use | 249.5 GiB |
| CPU | 72 Arm Neoverse-V2 cores |
| System memory pool | 506,017 MiB (494.2 GiB) |
| Total, GPU plus system pool | 762,720 MiB (744.8 GiB) |
| Link between them | NVLink-C2C, coherent memory |
The last row is the one that matters. On a PCIe workstation the GPU and system memory are separate places, and weights cross a bus to move between them. On the ZGX Fury the GPU’s memory appears to Linux as a second NUMA node of one coherent address space. That is why the experiments below behave the way they do, and it is also the source of the first gotcha.
A trillion parameters, one machine
Why this matters A trillion-parameter model normally needs a multi-GPU node, which means a rack, a queue or a cloud bill. Here one desk-side machine held the whole checkpoint and served it. That makes frontier-scale work possible for teams that cannot send their data out.
Kimi K2: 1.03 trillion parameters, 60 layers of 384 experts, a 549 GiB NVFP4 checkpoint, served with vLLM 0.29.0. 14.5 tokens per second for a single stream with 169 GiB of weights on the GPU, 35.7 across eight concurrent streams. Then I squeezed it: a mixture-of-experts model touches only a few experts per token, so I moved more of the weights out of GPU memory and measured again, three server loads per setting.
| Weights in GPU memory | Tokens per second, one stream | KV cache capacity |
|---|---|---|
| 168.9 GiB | 14.47 | 423,029 tokens |
| 87.2 GiB | 12.47 | 1,579,157 tokens |
| 44.5 GiB | 12.53 | 1,570,506 tokens |
A 3.8 times smaller footprint cost 13% of the speed and nearly quadrupled the KV cache.
The KV cache stopped growing below 87.2 GiB because the engine budgets a fixed 85% of GPU memory, and at 44.5 GiB its startup log shows about 53 GiB of GPU memory held outside its own allocator, against 11 GiB at 87.2. That took up the room the smaller footprint freed. I did not identify what held it.
Receipt fury-desk/results/H3_RESULT_v2.csv · results/H3_v2/serve_off*.log
Why it works: coherent memory over NVLink-C2C
Why this matters Published work reports CPU-to-GPU weight movement at 84 to 88% of each token’s time over PCIe (Madan et al., “Speculating Experts Accelerates Inference for Mixture-of-Experts”, arXiv:2603.19289, 2026; Qwen3-30B-A3B on an RTX A6000). If that share collapses on coherent memory, the design rules for serving large mixture-of-experts models change. I tested it directly.
I ran the same 35B model, engine and prompts on an RTX PRO 6000 workstation over PCIe and on the ZGX Fury, with 5 GiB of expert weights held off the GPU, three server loads of eight requests per arm.
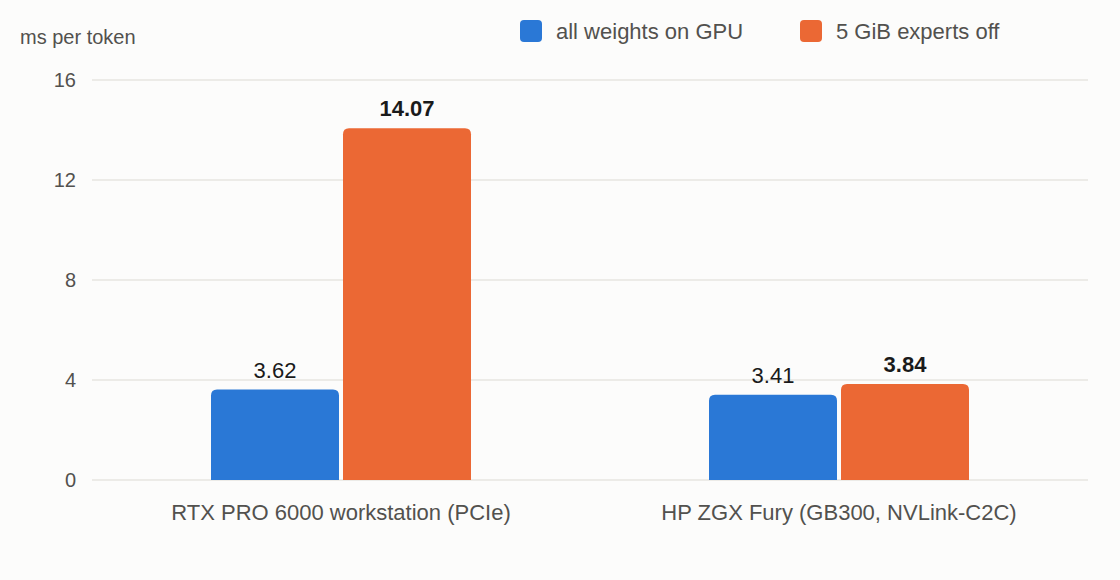
Median time per output token, averaged over three server loads. Share of each token spent moving weights, (offloaded − resident) / offloaded: 74.3% over PCIe, 11.3% on the ZGX Fury. Two machines, not one machine with the memory design toggled.
The penalty for keeping those weights off the GPU was 24.2 times smaller on the ZGX Fury: 10.5 ms per token over PCIe, 0.43 ms over C2C. From the slopes, the implied C2C transfer rate is about 365 GiB/s, 87% of nominal; that is an estimate built on a cross-machine difference, so treat it as an estimate. My PCIe arm read 74%, under the published band.
Receipt fury-desk/results/H1_RESULT.csv · results/H1_movement/
Does clever caching still pay?
Why this matters A literature of expert-prefetch predictors assumes that fetching an expert is slow because it crosses PCIe. If the link is fast, the predictor may not be worth building. I registered a cache keyed on the meaning of the conversation and charged every policy for the experts it moves.
My own idea was a cache keyed on the meaning of the conversation. I registered that it would beat recency and cross-layer predictors, more so as workloads repeat. It was falsified: over three trace collections it beat recency (LRU) by 2.07 points of hit rate, a cross-layer predictor beat LRU by 12.5, and the gap did not grow with repetition. Then I charged each policy for the experts it moves, which a hit-rate score never does.
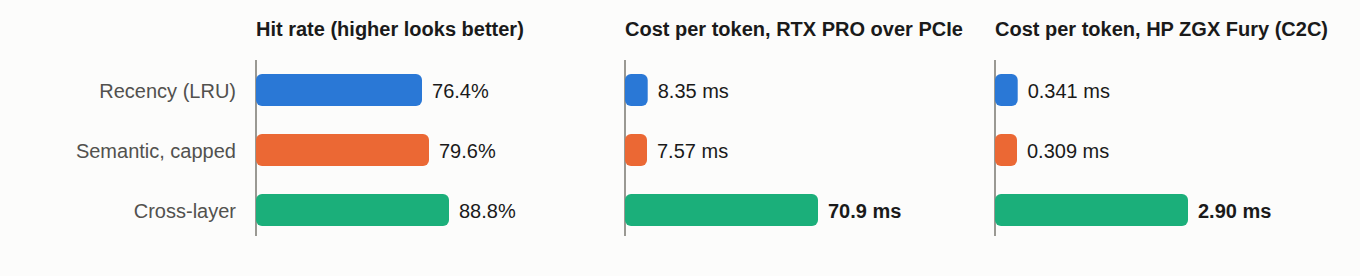
One Qwen trace, budget of 64 experts per layer, decode only. Costs are modeled from trace replay at the per-MiB rates measured above, with every transfer charged serially, which is an upper bound. Cross-layer moves 8.5 times the experts LRU does (+749%), because every wrong guess for the next layer is a transfer a reactive policy never makes.
Over PCIe, the cross-layer predictor with the best hit rate (88.8%, against LRU’s 76.4%) spends 70.9 ms of modeled transfer per token against LRU’s 8.35. Over C2C the same policies cost 2.90 ms against 0.34, on a token that takes 3.4 ms to compute. With perfect overlap, every prefetch hidden behind compute, the picture changes: cross-layer’s 2.74 ms of prefetch fits under 3.41 ms of compute on C2C, so it could edge ahead, while over PCIe at least 63 ms stays exposed. A point of hit rate is worth 0.353 ms over PCIe and 0.0144 ms over C2C.
Over PCIe, hit rate misleads. Over coherent memory, the policy barely matters.
That is an algorithmic argument for coherent memory, not only a capacity one: a layer of predictive machinery mostly stops paying. Every policy result here is a trace replay, not served live. Whether it holds at trillion scale with 300 GiB or more off the GPU is the next experiment.
Receipt fury-desk/results/H2_RESULT_v2.csv · results/H6_TRAFFIC.csv · verify/
What happens when an expert is missing
Why this matters Serving systems can trade accuracy for speed by dropping or substituting experts that are not resident. A benchmark that stays flat would make that trade look free. I measured quality directly as the miss rate rose.
I forced misses on a Qwen mixture-of-experts model and measured MMLU-Pro accuracy against the realized miss rate, 600 items per arm. Dropping the missing expert cost 18.5 points at an 8.5% miss rate and 35.0 points at 18.1%; substituting a resident expert was worse at the same rate (24.0 points at 8.1%). Quality did not fall off a cliff, and it was not silent either. The registered claim that benchmarks stay flat while quality craters was half right: quality did crater, in plain sight.
Caveats: one run per arm, 3 of 14 MMLU-Pro domains, and run-to-run churn of 12.7% between two identical control runs. The raw per-sample records and a verifier are in the repo.
Receipt fury-desk/results/H4_DOSE_RESPONSE.csv · verify/verify_h4_quality.py
Precision: NVFP4 against FP8
Why this matters A narrower number format halves the bytes per expert, so it should halve the cost of moving one. If bytes are the whole cost, a hit-rate point is worth less in NVFP4. I measured the cost per GiB moved in both formats.
On the RTX PRO 6000 the same 35B model ran 3.53 ms per token resident in NVFP4 against 4.47 ms in FP8. Then I swept the offload in both formats and fitted the slope. The registered claim that bytes are the currency was falsified: FP8 costs 15.8% more per GiB moved (2.43 against 2.10 ms/GiB), so something other than bytes is in the cost.
Receipt fury-desk/results/H5_LADDER_VERIFY.txt · results/H5_SCOPE.md · verify/verify_h5_ladders.py
Four setup choices for day one
Why this matters Each of these cost me real time, and none is a defect. All of them follow from the GPU’s memory being part of the same address space as everything else. Once you know them they take a minute to apply.
- Keep the file cache out of GPU memory. The GPU’s memory appears to Linux as a NUMA node, so Linux fills it with page cache: 150 GiB after loading the checkpoint. Launch with
numactl --preferred=0. Use--preferred, not--membind, so the system spills instead of stopping the process. - Leave offloaded weights unpinned. On a coherent system, pinned host memory is counted against GPU memory; vLLM’s own offloader skips pinning on Grace-class systems for the same reason.
- Offload expert tensors, not dense layers. Dense layers are read on every token, experts only when routed, so offloading experts moves the fewest bytes per token.
- Check the GPU is idle before you trust a latency number. A departmental box will have neighbors. On my workstation two embedding servers and an inference engine kept the card 97% busy, and my copies and kernels waited 1.3 to 2.4 ms for their turn. Record
nvidia-smialongside every benchmark.
Fine-tuning a 27B model on private data
Why this matters Many teams cannot send their data to a cloud to adapt a model, so a fine-tune has to fit on a machine they control. Memory, not compute, is usually what stops a 27B fine-tune on one workstation. Here it ran in an afternoon. On a machine you own, the data stays in the room.
A LoRA on every linear layer of a 27B model: 50,604 examples, 13 million tokens, 2.09 hours, peaking around 162 GiB, more than the 96 GB of my workstation card (bf16 base, no QLoRA). On 1,500 held-out examples of the domain’s main decision task, with the base model given the same 2,048-token budget, accuracy went from 33% to 86%, at a cost of 2.4 points on GSM8K. Training ran on the ZGX Fury; I scored both arms on my workstation after my access ended, serving the NVFP4 base with and without the adapter.
Receipt fury-desk/results/finetune/FINETUNE_RESULT.txt · train_manifest.json
Small models, fast answers
Why this matters Not every job needs a trillion parameters. Services that make a call on every event care about the time to a first answer. These are the numbers for three models on this machine.
I measured the time to a one-word first answer, and the time to a full decision with its reasoning, median of three server loads on a quiet GPU.
| Model, NVFP4 | First answer | Full decision |
|---|---|---|
| 35B mixture-of-experts | 46.5 ms | 131.2 ms |
| 27B dense | 75.8 ms | 257.4 ms |
| 4B fine-tune | 50.3 ms | not measured |
Receipt fury-desk/results/latency/decision_latency.csv
What I got wrong
Why this matters The experiments were registered before I touched the machine, and several of my own results did not survive checking. A reader who sees only the wins cannot judge the rest. The full ledger is in the repo.
-
A footprint of 590 GiB. I first reported 4.65 times less resident for about 12% slower. The 590 came from a comment in my own script; the serve logs say 549.4 GiB. I withdrew the claim and re-ran it with three server loads per setting and residency read from the engine’s own log: 3.8 times for 13%.
-
Pages that moved on their own. GPU memory grew by exactly 8 GiB, so I wrote that the platform migrates pages and residency cannot be controlled. It was PyTorch’s allocator. Growth that lands on exactly half of a 16 GiB buffer, unchanged by three independent controls, is a benchmark artifact.
-
The wrong layers. My first coherent-memory test offloaded every layer and measured 92 to 97% of each token spent moving weights. It was a valid measurement of the wrong thing; experts only gave the 74% and 11% above.
-
A headline that was five-sixths prefill. My first H2 headline blended prefill and decode. I split them.
-
Traffic overstated 46 times by per-token counting. I corrected it in the ledger.
Receipt fury-desk/corrections.md · results/H3_MIGRATION_RETRACTION.md · results/H1_movement_alllayers/
Right tool for the job
Why this matters Buying the wrong class of machine for a workload is an expensive mistake in either direction. The two system types here win for different reasons. The deciding questions are where the working set lives and how fast one thread of work runs.
A latency-bound simulation I built answers in 0.70 ms on the ZGX Fury. It did not start there: its first version ran 25.91 ms on the ZGX Fury and 19.36 ms on my own desktop workstation, because single-threaded host code and a serial GPU kernel run at clock speed, where a desktop is quicker. Rewriting the code made the difference, not the hardware, and the desktop still runs the final version faster: 0.45 ms against 0.70, measured a week later on an idle card with all 200 results identical to the ZGX Fury’s.
| ZGX Fury | Single-GPU RTX PRO workstation | |
|---|---|---|
| Wins when | the working set outgrows 96 GB, or a miss is expensive | the job fits in 96 GB and its critical path is a serial chain |
| Why | coherent memory: 0.43 ms per token held 5 GiB off the GPU, against 10.5 ms over PCIe | a higher boost clock (3,090 MHz maximum on the workstation, results/workstation_clocks.txt) and faster single-thread CPU cores |
| Examples here | a 549 GiB model, a 162 GiB fine-tune, 1.5 million tokens of KV cache | a latency-bound simulation of 0.45 ms against 0.70 |
My desktop is a machine of my own, not an HP product. HP sells RTX PRO cards in its Z workstations; I did not test one. Past 96 GB, the ZGX Fury is the only one of the two that runs the job at all; my workstation is a single-GPU machine.
Reproduce it
Why this matters Reproducible matters more than polished. The scripts below launch the experiments in this article and write the same result files I report. Run the sweeps on a PCIe machine too, and you can check the comparison yourself.
git clone https://github.com/VoxellInc/fury-desk && cd fury-desk
./serve/serve_kimi_k2.sh                            # K2, preferred NUMA, unpinned
OFFLOADS="380 460 505" ./sweeps/h3_sweep_v2.sh       # offload curve, 3 loads each
ARCH=coherent OFFLOAD_PARAMS=w13_weight,w2_weight \
  MODEL=... VENV=... ./sweeps/h1_movement_fraction.sh   # also run on a PCIe box
The repo. github.com/VoxellInc/fury-desk: full source for the serve scripts, the sweeps and the benchmark harness, the raw result files behind the numbers, and the corrections ledger. The simulation’s source is not published; its run data is. Questions: DM me on LinkedIn, linkedin.com/in/jonathancorners.
What I did not measure
- Anything physical: noise, power draw, thermals. The unit was hosted and I reached it over SSH.
- Production concurrency on the trillion-parameter model beyond eight requests.
- A coherence ablation with bandwidth held fixed. My comparison is two machines, not one machine with the memory design toggled.
- A second fine-tuning seed. The training result is one run.
- Any caching policy served live. Every policy result here is a trace replay.
Related from Voxell