HP provided two weeks of remote access to an HP ZGX Fury at no cost through its Lighthouse evaluation program and reviewed this paper for accuracy about HP products. The experiments, results and opinions are my own.
On my last day with the machine the scan took 25.91 milliseconds at the start. By the end of the day it took 0.70. Same GPU, same inputs, and at every step the output was identical down to the last byte for the same number of results returned.
Anybody can make a Monte Carlo engine faster by making it slightly wrong. Drop some paths, loosen a tolerance, let two threads race on a counter and call the difference noise. I wanted the other thing: an engine that got more than a thousand times faster since its first version and can show, mechanically, that it computes the same numbers. And the biggest single win of the day had nothing to do with the GPU.
This is written for builders. Every timing below has a result file in github.com/VoxellInc/fury-desk/montecarlo-data: per-scan timings and a hash of each scan’s result. The exceptions are the timings before the full board, in the first table and the first two rows of the staircase, which come from my engineering log and are marked where they appear. The engine’s source is not published.
One event, three thousand questions
Why this matters Many systems have to rescore a large set of dependent outcomes the moment one input changes. A result that arrives after the world has moved again is worth nothing, so the metric is time to a ranked answer. The shape here carries to any basket of correlated outcomes.
Something happens in the world and one input changes. A few thousand scores that depend on it are now stale, and they stay stale until you recompute them. Each score is for a combination: a small set of conditions, two or three or four of them, that all have to come true. The conditions are correlated, because they hang off the same underlying process, so you cannot multiply the individual probabilities. You need the joint probability, and the honest way to get one over a messy process is to simulate it: ten thousand paths, each a chain of 360 steps, and count what happened.
On the workload I measured, the board has fifteen inputs, a pool of 47 candidate conditions, and 2,966 combinations to score and rank. Sometimes the input itself is uncertain, so the whole thing runs as a weighted mixture of scenarios. The metric is not throughput. It is time to result for one event. I am going to stay at that altitude about what is being scored: the domain is not the point, the engineering is.
Rule zero: the answer is not allowed to change
Why this matters Speed work on a stochastic engine is dangerous, because a faster engine that is slightly wrong looks the same as a faster engine that is right. Determinism turns that into something a machine can check. It is what let me be reckless.
- Integer state everywhere. Time in thousandths, probabilities in parts per million. No floating point drift between a CPU and a GPU, because there is no floating point to drift.
- Counter-based random numbers. A draw is a pure function of the seed, the path and the step. It does not depend on what was drawn before it. Remember this one. It comes back.
- Two implementations of the same engine. Rust on 72 CPU threads, and CUDA. The self-test only passes when at least two independent implementations ran and their output hashes are equal.
- Every speed change ships with an exactness gate. Not a tolerance. A byte comparison.
When any change that breaks the answer fails loudly within seconds, you can rip out a kernel and replace it with something strange at four in the afternoon, because the gate will tell you if you were wrong before you report a number to anyone.
Receipt fury-desk/montecarlo-data/a_selftest.json
858 ms to 6: stop asking the same question twice
Why this matters The first version answered each question with a fresh simulation, so cost grew with the number of questions. Nothing about a simulated path depends on which question comes next. Sharing the simulation changed the cost curve before any GPU work began.
A three-condition combination needs seven probabilities: the joint and every subset. The naive engine ran a fresh simulation for each question: 858 milliseconds for 58 combinations. The fix is the idea the rest of the engine is built on. Simulate once, and for every path record a single 64-bit mask, one bit per condition, set if that condition came true on that path. Any combination, of any size, is then a fold over those masks: AND, compare, popcount, one warp per subset, reduced with shuffles. All distinct conditions across every candidate are pooled, so the cost is one simulation per scenario instead of one per question.
| Version | Scan time | Combinations |
|---|---|---|
| A fresh simulation per question | 858 ms | 58 |
| Masks, one set per combination | 101 ms | 58 |
| Pooled conditions, one simulation per scenario | 6.0 ms | 58 |
| The full board | 33.5 ms | 2,966 |
These four rows come from my engineering log; there is no raw result file for them in the repo.
The correctness gate for this step re-asks every subset the slow way, with the same seed and the same paths, so any difference is a bug and not sampling. Eight conditions, 255 subsets, zero mismatches in three runs. Batched: 1.64 to 1.70 ms. Serial: 405 to 417 ms. That is 242 to 249 times, and the gap widens with every condition you add, because the serial version is exponential in the number of conditions and the batched version is flat.
Receipt fury-desk/montecarlo-data/c_verify_gb300.jsonl
The morning: 25.91 ms, and the big machine lost
Why this matters A faster, more expensive machine is not automatically faster for your job. On the last day the scan ran on two boxes and the bigger one lost. Finding out why took five timestamps and no profiler.
By the last day the scan was running on two boxes. The first was the ZGX Fury evaluation unit: an NVIDIA GB300 with 152 streaming multiprocessors, 251 GiB of GPU memory and 72 Arm cores. It was never on my desk; for two weeks it was an IP address at the far end of an SSH session. The second was my own workstation: an RTX PRO 6000 Blackwell with 96 GB, next to an i9-14900KF. Same engine, same inputs, 200 scans after warm-up.
| p50 | p99 | |
|---|---|---|
| GB300 (ZGX Fury) | 25.91 ms | 27.26 ms |
| RTX PRO 6000 workstation | 19.36 ms | 22.05 ms |
The bigger machine was slower, which is the kind of result that makes you want a profiler. In the hosted evaluation configuration, no perf build existed for the unit’s kernel, and the GPU’s counter profiler needed admin rights I did not have. So I did the dumbest thing that could work: five timestamps inside the scan function.
| Stage | GB300 | What it was doing |
|---|---|---|
| Board | 3.42 ms | Rebuilding every board in the set, then filtering down to one |
| Candidates | 3.59 ms | Enumerating combinations with JSON descriptors and a linear search |
| The GPU call | 2.21 ms | Simulation, masks, subset fold, copy back |
| Assemble | 9.85 ms | Building 2,966 JSON result objects |
| Rank | 6.03 ms | Sorting JSON values, then discarding 2,766 of them |
| Total | 25.07 ms |
91% of the scan was host-side work, nearly two thirds of it building JSON. The GPU, the thing I had spent weeks on, was 2.2 milliseconds.
I had built roughly three thousand result objects, sorted them as generic JSON values, and thrown away all but two hundred, on every scan. That is why the big machine lost: it was single-threaded host work, and its Arm cores are slower single-threaded than a desktop i9. The GPU never got a vote.
Receipt fury-desk/montecarlo-data/d_stages_gb300_stats.txt · b_scan_*_stats.txt
25.91 to 3.50: rank numbers, then describe the survivors
Why this matters The cheapest speedup is to stop doing work whose result you throw away. Here that was building rich objects for 2,966 results to show 200. Two changes read straight off the five timestamps removed most of the time.
The host. Rank plain structs. Build JSON only for the results you keep. Score one board instead of rebuilding fifteen and filtering. Replace the linear search with a hash map. None of this is clever, and all of it was invisible until I measured.
The launch shape. The simulation kernel used 255 registers per thread, which meant exactly one 256-thread block fit on each multiprocessor. Ten thousand paths became 40 blocks on 40 of the 152 multiprocessors, by my arithmetic about 3.3% of the GPU’s thread slots. I spread the blocks across every multiprocessor.
| Before | After | |
|---|---|---|
| GB300, p50 / p99 | 25.91 / 27.26 ms | 3.50 / 3.62 ms |
| RTX PRO 6000, p50 / p99 | 19.36 / 22.05 ms | 2.48 / 3.03 ms |
Same result across 200 scans, at every block size, and between the two machines. Seven times faster, and the workstation card was still winning. But now the GPU call was the largest stage, which meant the reason had changed.
Receipt fury-desk/montecarlo-data/g_host_fix/ · SUMMARY.md
3.50 to 2.49: find the thin chain
Why this matters A serial chain runs at the speed of the clock, however many multiprocessors sit idle next to it. Many simulations that look sequential are not. Finding the thin chain inside one is what turned a latency problem into a parallel one.
The simulation kernel ran one thread per path, and each thread walked its 360 steps in a row. That is a serial chain, and it does not care how many multiprocessors are idle beside it. The workstation card clocks up to 3,090 MHz, which I read from nvidia-smi; the GB300 runs a lower boost clock. Spreading the blocks had bought only 1.1 times on the GB300 (3.90 to 3.50 ms with the host fix in place), and more of that was not going to help.
The simulation looks sequential, and it is not. Because the random numbers are counter-based, what a step would do does not depend on the history of the path. Only three small pieces of state carry forward from one step to the next, and one of them just selects between two regimes. So everything expensive, the hashing and the picking and the outcome, can be computed for every step at once, under both regimes, without knowing the history. One warp per path: thirty-two lanes take thirty-two steps, each lane does the heavy part for its own step under both regimes, and a recurrence built from warp shuffles resolves the thin chain of state through all thirty-two. Lanes credit shared counters with saturating adds of non-negative values, which are order-free, so the result is bit-identical to the serial reference. Not close. Identical.
for (int base = 0; base < n_steps; base += 32) {
  Out a = step(seed, path, base + lane, REGIME_A);  // heavy: hashes, table picks
  Out b = step(seed, path, base + lane, REGIME_B);
  for (int j = 0; j < 32; ++j) {          // thin chain: a few int ops per step
    Out oa = __shfl_sync(FULL, a, j), ob = __shfl_sync(FULL, b, j);
    int r = regime(state), on = live(state);   // every lane walks it
    if (j == lane) { my_r = r; my_on = on; }
    state = advance(state, r ? ob : oa, on);
  }
  if (my_on) credit(counters, my_r ? b : a);  // saturating add, values >= 0
}
Two smaller things rode along. Fuse what only exists to be re-read: the simulation had been writing 2.6 MB of per-path records so a second kernel could read them back and test conditions; testing them inside the simulation’s own shared memory removed the write, the read and a launch. Stop allocating: each scan made seven device allocations at about 14 microseconds apiece, a hundred microseconds against a 150 microsecond kernel, so the buffers now stay resident and the scan syncs once.
| GB300, idle | One thread per path | One warp per path, fused |
|---|---|---|
| Scan p50 / p99 | 3.44 / 3.51 ms | 2.49 / 2.54 ms |
| GPU wall time per scan | about 2.3 ms | about 290 µs |
| 20.55 million paths, pre-computed | 1,014 ms | 586 ms |
| 255-subset query, batched | 1.65 ms | 0.31 ms |
Inside that 290 microseconds: 196 for simulation and masks, 47 for the subset fold, about 5 for copies. The first build of the warp kernel failed the self-test, because a chunk cut at a boundary advanced by 32 and skipped steps. The hashes disagreed, the gate went red, and I fixed it before a number left the building. That is the contract doing its job.
Receipt fury-desk/montecarlo-data/h_warp_kernel/ · SUMMARY.md
2.49 to 0.70: put the board on the device
Why this matters With the GPU down to 290 microseconds, the remaining two milliseconds were host-side Rust again. Moving candidate generation, scoring and ranking onto the device removes the host from the critical path. The last halving came from asking for what is displayed.
- One warp per candidate slot. The slot number decodes directly to a combination. Slot order is the host’s enumeration order, so ties in the ranking break identically.
- One pass over every scenario. All scenarios are simulated in a single launch. Each warp counts its joint across the whole mixture, applies the weights and the exclusion masks, and computes the score in the same integer arithmetic the host uses.
- Rank on the device. A one-block bitonic sort, then a gather kernel that emits only the results that are kept.
Five launches, one sync, resident buffers. That got the scan to 1.42 ms, and the stage timers had one more thing to say: the largest remaining stage was building JSON for 100 results when the screen shows ten, 0.65 of the 1.42. I asked for what is displayed.
| GB300, idle, 200 scans | p50 / p99 | Where the time goes |
|---|---|---|
| Host path | 1.84 / 1.89 ms | Candidates 0.54, GPU 0.85 |
| Device path, 100 results | 1.42 / 1.45 ms | Device 0.41, JSON 0.65 |
| Device path, 10 results | 0.70 / 0.71 ms | Board 0.22, device 0.40, JSON 0.07 |
Look at the p99: one hundredth of a millisecond above the median. On an idle GPU with resident buffers and a single sync, nothing left in the path can surprise you. The exactness check for this step compared the device path to the host path at 5, 100 and 2,000 results, where 2,000 means the full ranked list of all 2,966 combinations with every tie. It compared them again with two scenarios, with seven, and with one input removed entirely. Same result on both machines.
Receipt fury-desk/montecarlo-data/scan_gb300_device10.timings.jsonl.gz · scan_gb300_host10.timings.jsonl.gz
The whole staircase
Why this matters A speedup story is only useful if you can see each step and what it cost. This is the whole path from the first version to the last, and the last five rows are one day. Each step was gated by a byte comparison.
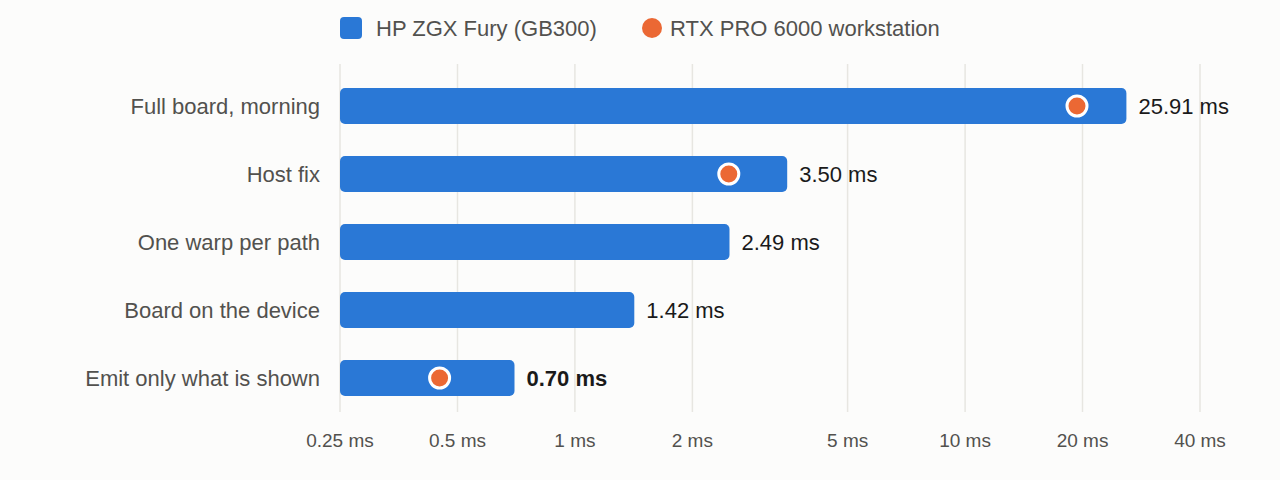
Blue: HP ZGX Fury (GB300). Orange: RTX PRO 6000 workstation, where measured on an idle card (the final point is from a rematch a week later). Scan median over 200 scans after warm-up, same 2,966 combinations, log scale. p99 of the last step 0.71 ms.
| Step | Scan p50 | What changed |
|---|---|---|
| First version | 858 ms (58 combinations) | A simulation per question |
| Shared simulation, masks | 6.0 ms (58) | One simulation answers every question |
| Full board, morning of the last day | 25.91 ms (2,966) | Fifty times more work |
| Host fix, launch shape | 3.50 ms | Stopped building JSON to throw away |
| One warp per path, fused | 2.49 ms | Parallelism inside the chain |
| Board on the device | 1.42 ms | Generate, score and rank on the GPU |
| Emit only what is shown | 0.70 ms | Ten results instead of a hundred |
From the first version to the last, the scan got about 1,200 times faster while doing 51 times more work: per combination, 14.8 milliseconds down to roughly a quarter of a microsecond. The first two rows come from my engineering log.
The rest of the pipeline moved too
Why this matters Once the hot path lived on the device, it felt strange that anything else did not. Three more pieces moved, all measured on the GB300. They show how much of a pipeline can stay on the GPU between host launches.
- Ingest. The host reads bytes and launches. The device builds the line index, parses one line per thread, accumulates totals in a compare-and-swap hash and joins the latest status with an atomic max: 115,332 lines of JSON, 37 MB, parsed in 0.6 ms. The host still reads the file (4.0 ms), uploads it (2.7 ms) and compiles the kernels with NVRTC (29 ms), which the 0.70 ms figure does not include.
- The cascade. When one input changes, 121 second- and third-order scenarios follow from it. Device: 0.053 ms. Host: 0.147 ms. Zero mismatches across 3,872 slots.
- A control plane that writes its own to-do list. In plain terms, it is a work queue that lives on the GPU: when a statistical test passes, the GPU itself queues the checks that could prove it wrong, instead of waiting for the host to decide. The host seeds a set of statistical fits and reads back a verdict; it does not decide what to test next. A fit that clears its threshold reserves queue slots and writes its own placebo, its own falsifier and two split-half checks, which other multiprocessors pick up in the same pass: 2,832 tasks, 168 of them commissioned by the device itself, in 2.6 ms.
The board kernel also ran standalone at 0.171 ms for 67,200 rows. It was not wired into the scan above, so that number is not part of the 0.70.
Receipt fury-desk/montecarlo-data/f_cpg.txt · f_cascade_feed.txt · f_board_run.txt
Two ways I fooled myself
Why this matters The speed is the fun part, and these are the parts I would want to know if I were you. Both nearly put a wrong number in front of a reader. Each was caught by a habit, not by luck.
A shared GPU is a time-sliced GPU. When I went to measure the warp kernel on my own workstation, the card was at 97% utilization and 598 watts from other things I run on it. My kernels were fine. The trace showed my copy starting 1.3 ms after the host issued it and the kernel 2.4 ms after that, because the GPU was busy running someone else’s context. A latency number from a busy GPU measures the neighbors, so I did not report it. A week later I reran on an idle card (3% load before the run) and got 0.45 ms against the GB300’s 0.70.
A ratio I had typed in, not measured. The board harness prints a 388 times speedup, using a 66.3 ms host figure that I wrote into the harness from an earlier console measurement. It was not re-measured that day, so I did not quote the ratio.
Receipt fury-desk/montecarlo-data/rematch_2026-10-03/ · SUMMARY.md
Which machine wins
Why this matters The result above is a statement about this workload, not about either machine. Two things decide which machine wins a given job: where the working set lives, and how fast one thread of work runs. Knowing which applies saves you from buying the wrong class of system.
The same final build, run a week later on the workstation with the card idle, took 0.45 ms median (p99 0.64) against the GB300’s 0.70 (p99 0.71) from September 26, and all 200 results were byte-identical across the two machines. That is the shape of this workload, not a verdict on the GB300. When the data fits in the workstation card’s 96 GB and the critical path is a serial chain (a latency-bound kernel, single-threaded host code), clock speed decides it: the workstation card clocks higher, a desktop CPU core outruns a Grace core, and the workstation wins, as it did here at every step. Once the working set outgrows the card, what decides it is the cost of a miss: holding 5 GiB of model weights off the GPU cost 10.5 ms per token over PCIe and 0.43 ms over the GB300’s coherent link. Past 96 GB (a 549 GiB model, a 162 GiB fine-tune) the ZGX Fury is the only one of the two that runs the job at all; the workstation is a single-GPU machine.
Footnote: the workstation’s p99 was 0.64 ms against the GB300’s 0.71. It is an active development box with neighbors, so I read nothing into its spread.
Receipt fury-desk/results/H1_RESULT.csv
What I did not measure
- Achieved occupancy from hardware counters. The GPU’s counter profiler needed admin rights that the hosted evaluation configuration did not grant; the 3.3% figure is computed from launch geometry.
- Concurrency. This is one event at a time on an idle GPU.
- The GB300’s clock during the runs. I did not capture it, so I give no figure for it.
- Sampling noise. Exactness is not accuracy: ten thousand paths is a sampling choice, and speed does not fix sampling noise. The next move is more paths, not fewer milliseconds.
What travels
Why this matters If you are building anything that rescores a lot of correlated things when one input moves, these outlast my specific engine. None of the individual moves is exotic. What made the day work was the order: lock the answer down, measure before guessing, and let the measurements pick the next target.
- Put five timestamps in before you reach for a profiler. 91% of my engine’s scan time was host-side work, most of it JSON.
- Rank numbers, then describe the survivors. Never build a rich object you are about to throw away.
- A latency-bound kernel does not scale with multiprocessors. If the big machine loses to the small one, you have a serial chain running at clock speed.
- Look for the thin chain. With counter-based randomness, most of a “sequential” simulation is not sequential. Compute the heavy part for every step under every state it could be in, then resolve the small recurrence.
- Make accumulation order-free and you get parallelism and exactness at the same time.
- Fuse what only exists to be re-read. If one kernel writes a buffer so the next can read it, they want to be one kernel.
- Emit only what is shown. The last halving came from not serializing 90 rows nobody was looking at.
- Make the answer immutable first. Every one of these changes was safe to try because a byte comparison was waiting at the end of it.
One box. Ten thousand paths. Seven tenths of a millisecond, and not one byte different.
Jonathan Corners · Founder, Voxell Inc. · linkedin.com/in/jonathancorners
The data. github.com/VoxellInc/fury-desk/montecarlo-data: timings, stage splits, kernel tables and result hashes for every step. The engine’s source is not published. Questions: DM me on LinkedIn, linkedin.com/in/jonathancorners.
Related from Voxell